Reading the coverage browser
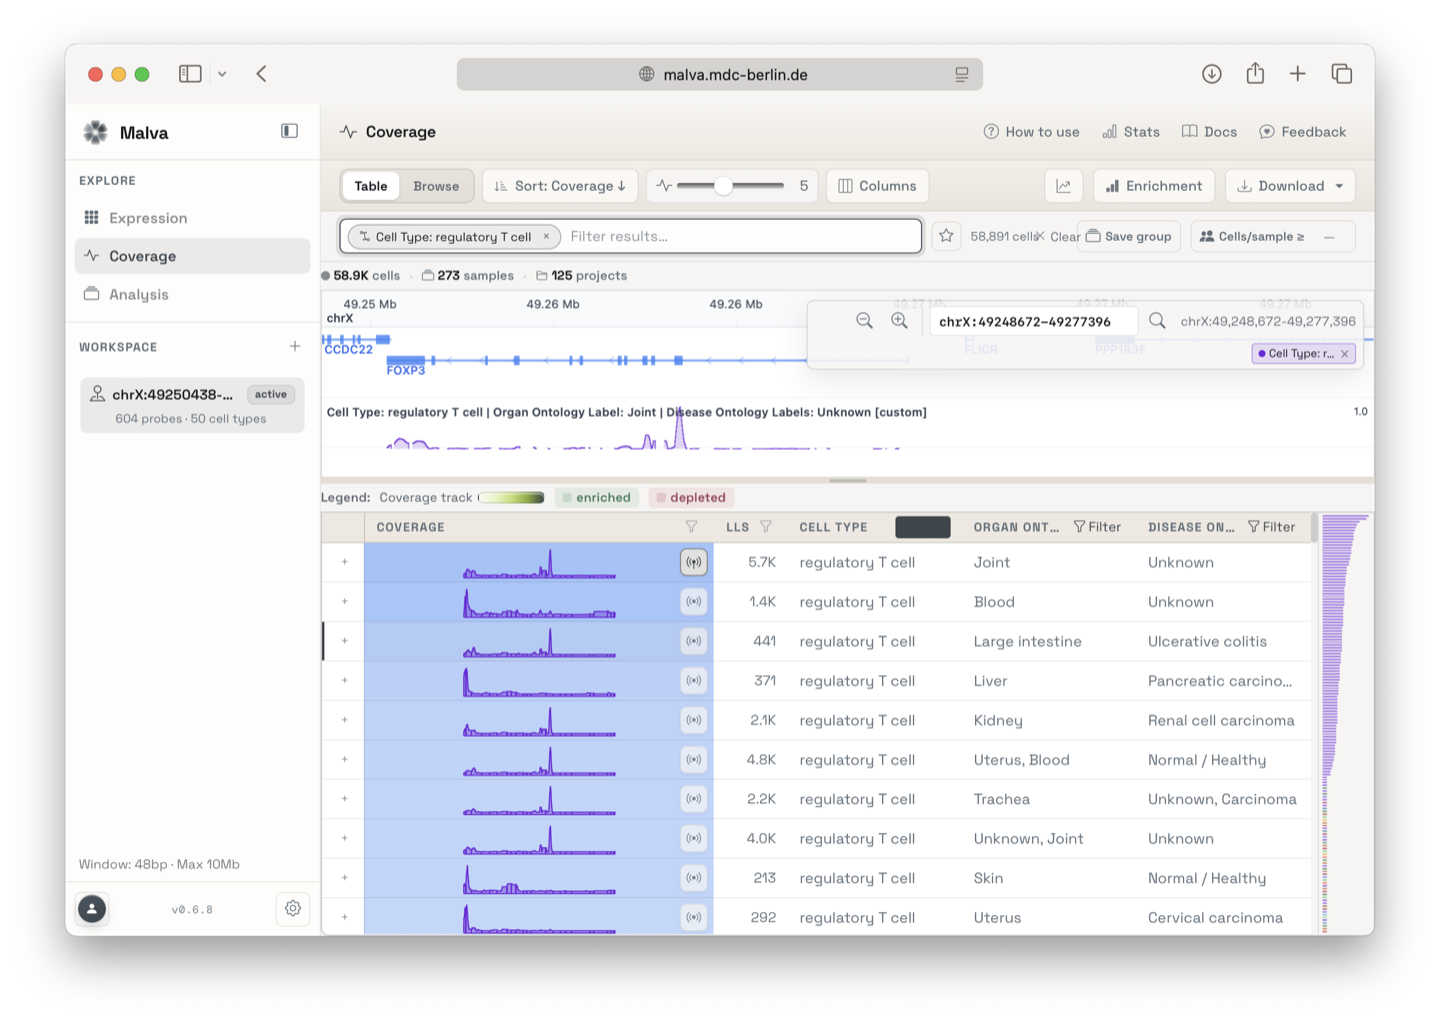
The coverage browser shows, for every group in your results, how reads pile up across the region you searched. Each row carries its own coverage track, so you can compare groups side by side.
Navigate the browser
- Zoom with the zoom in and zoom out buttons, or use the mouse wheel. The browser redraws the tracks at the appropriate resolution for the current window.
- Pan by dragging the tracks, or type a locus such as
chr1:1200000-1800000into the locus input to jump straight there. - Smoothing aggregates reads into wider bins. Drag the slider to reveal broad signal at higher values, or to keep fine-grained peaks at lower values.
Read the tracks
Each track shows read depth along the locus for one group. Taller stacks mean more reads cover that position, which indicates more cells from that group transcribe the region.
The results table
The table below the browser lists the groups of cells in your results, one row per group. Each row shows:
| Column | Meaning |
|---|---|
| Track | Coverage across the region for the group |
| Cells | Number of cells in the group |
| Metadata | The active metadata values, for example cell type, organ, and study |
Rows are sorted by total coverage by default. Use the Sort menu to order by cell count instead, or click a row to expand it.
Switch to the Browse view
The view switch toggles between the results Table and Browse, a catalog view of the metadata behind your results. Browse groups the matched samples by publication, organ, disease, study, cell type, or laboratory, and shows the cell and sample counts for each value.
You can choose the detail level (Auto, Compact, or Full) and export the current browse list as Summaries text or Full info XML.
Enrichment
The Enrichment toggle adds a summary that shows which metadata values are over-represented among the rows with the highest coverage.
How is enrichment computed?
Enrichment compares how often a metadata value appears in the top-covered rows against how often it appears across all visible rows. Significance is tested with a one-sided Fisher's exact test, and the p-values are FDR-corrected across all tests. Only values with q below 0.05 are shown. A fold change above 1 means the value is over-represented; below 1 means it is depleted.
Downloads
From the Download menu you can export the coverage matrix for all positions, or save the current browser view as an image. See Downloads and exports for the full list.
Filters
The metadata filtering described for the Expression Explorer applies here too. Narrow the results by publication, organ, or disease before exploring the tracks.