Reading the results
Once a search finishes, the result view opens. This is the main view of the Expression Explorer.
The results table
The table lists the groups of cells that match your query. A group is defined by its metadata: one row per cell type by default, and per organ, disease, or study if you add those columns. Each row aggregates the cells of all samples that share those metadata values.
The columns show:
- an expression column per search, with the value as a coloured heatmap cell and a small whisker plot inside it,
- the Cells count, the number of cells in that group,
- the metadata columns you have active, for example cell type, organ, disease, and study.
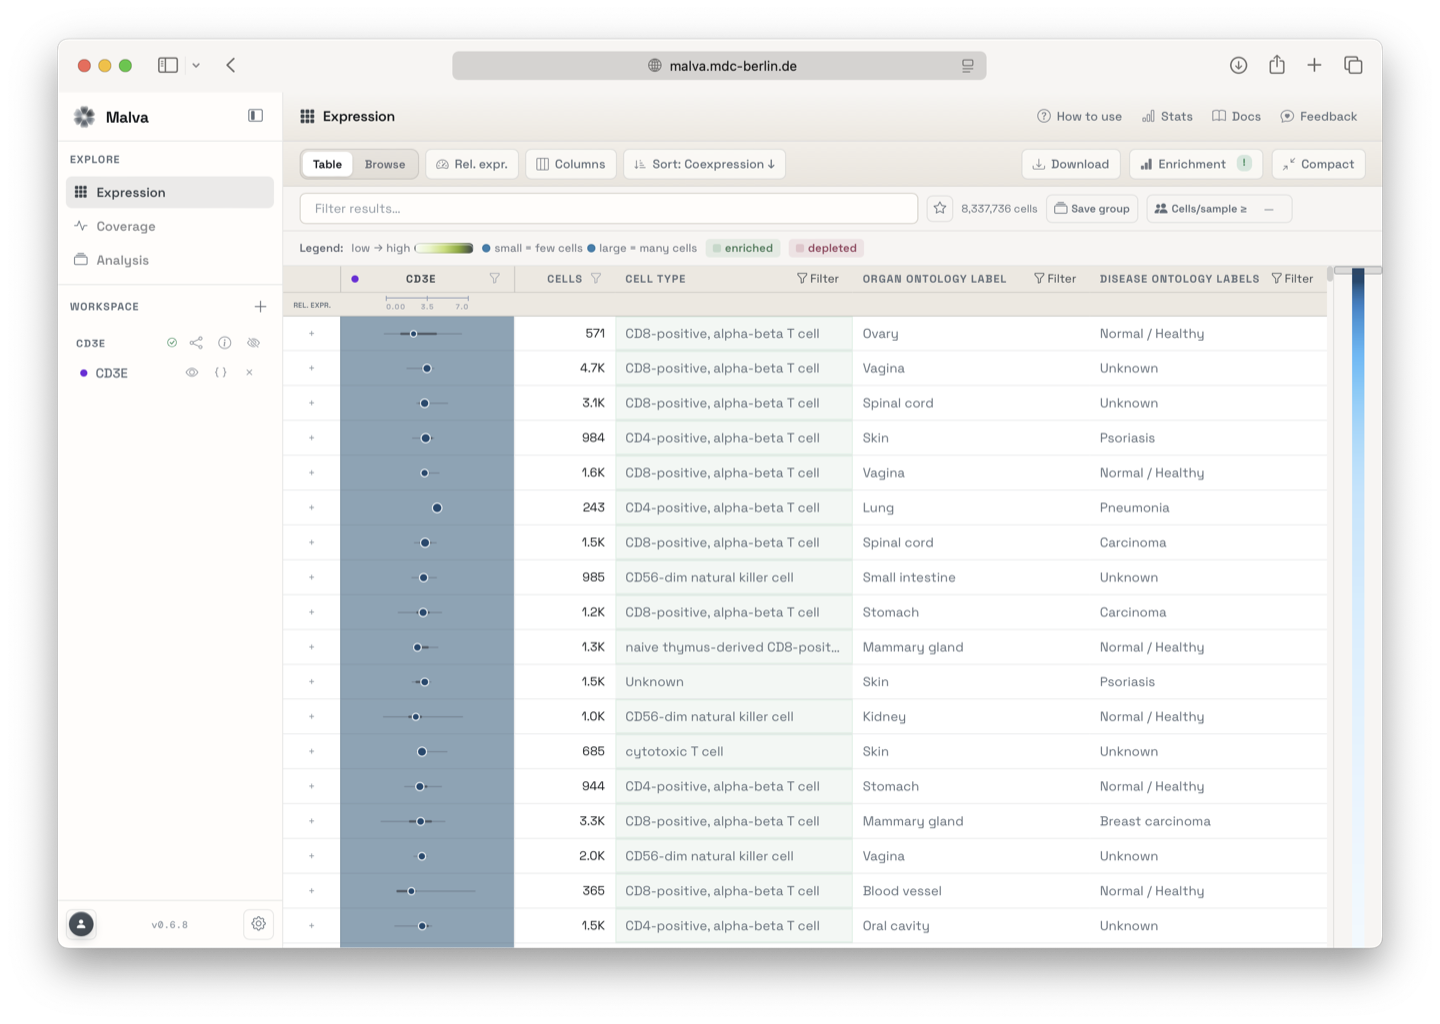
Double-click any metadata value to keep only rows with that value. Click any row to expand it and inspect the samples behind it, or select rows and use Save as group.
The whisker in each expression cell
Each expression cell plots the distribution of your query genes across the group:
- a thin line from the minimum to the maximum observed value,
- a thicker bar for the interquartile range (25th to 75th percentile),
- a median circle whose radius encodes the fraction of cells expressing the genes: larger circles mean more cells express them.
Hover the cell for the full summary: mean, median, Q25-Q75, fraction of expressing cells, and the number of cells and samples in the group.
Metadata enrichment
Metadata values are highlighted when they appear more often than expected among the top rows. A cell marked enriched (or depleted) means the value is over-represented (or under-represented) in the rows with the highest expression, with a fold-change and an adjusted p-value in the label.
How is enrichment computed?
Enrichment compares how often a metadata value occurs in the rows with the highest expression against how often it occurs across all visible rows. A value with a fold change of 2 or more is marked as strongly enriched, 1.5 or more as enriched, 0.5 or less as depleted, and 0.3 or less as strongly depleted. The significance is tested with Fisher's exact test, and the p-values are corrected across all tests.
How the expression values are shown
The heatmap colour and the whisker values depend on the display mode you choose. The default mode is Relative expression.
- Relative expression, the default. A normalised value that corrects for sequencing depth and sample size, so you can compare groups that were sequenced with different technologies or depths.
- Fraction expressing. The proportion of cells that detect the gene, from 0 to 1. This measures breadth, not strength: a gene can be expressed weakly but in most cells.
- Raw kmer hits. The mean raw count of matching sequence hits per expressing cell. This reflects sequencing depth and is not normalised.
- Cell count. The number of cells in each group, independent of expression.
The colour scale follows your chosen scheme. You can switch between blue, divergent, and viridis; the scale adapts automatically to the light or dark theme, so the same value always maps to the same relative position.
What does the relative expression value mean?
The value is ln(1 + 10E), where E is the group mean expression, zeros
included, divided by the per-sample median. The result ranges from 0 to
about 7. A value of 1.6 or higher usually means the gene is clearly
expressed; values near 0 mean little or no expression above background.
What does the colour intensity mean?
The intensity combines both the strength of expression (the normalised mean) and its breadth (the fraction of expressing cells). The scale is relative to the data in the current view, so the darkest cell shows the strongest combination among the visible rows. The scale is not a fixed threshold and differs between light and dark mode.
The detail panel
Click a row to open the detail panel for that group. It shows:
- a header with the number of cells and samples in the group,
- buttons to Copy IDs, CSV, DOIs, and SRA accessions,
- facet chips for study, organ, disease, species, and sex. Click a chip to list its values, then click a value to filter the results to it,
- the group's samples, grouped by study, with the full metadata for each sample.
Click a sample to open its detail drawer with all its metadata and external links to the original data.
Long lists
The detail panel shows the first 200 samples per study. For the complete list, use Copy IDs or the CSV export.
The search card
Each search you ran stays available as a card in the sidebar. You can:
- view the query and its status,
- rename the search,
- reach the job history and sharing options.
Comparing searches
When you run several searches in one job, the results stay side by side. The All genes combined control treats every search together, so the values and statistics in the table combine across all the genes you queried instead of one at a time.